Bitcoin is being stockpiled
What HODL Waves reveal about a network increasingly built on saving.
Using bitcoin as long-term savings makes sense given its principles, but what if we could see that this is indeed the behavior of bitcoin holders? It turns out, we can.
Every bitcoin settlement transaction is recorded, and visible to the entire network. While the people behind those transactions are typically anonymous, the data itself is incredibly revealing. It shows us how much value moves across the network over time, and how long people tend to hold their bitcoin before spending or moving it.
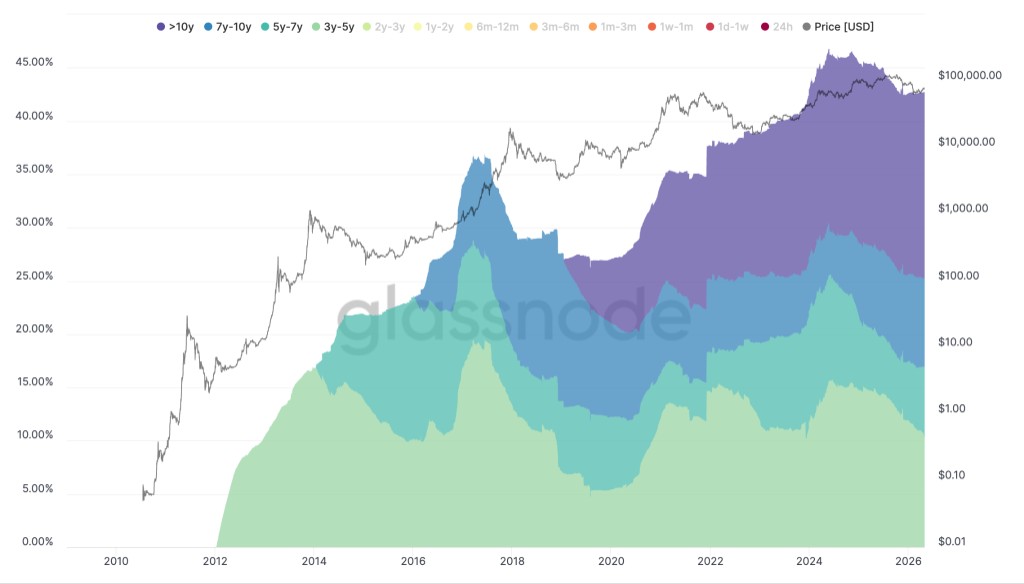
The length of time that balances are held reveals that people are increasingly treating bitcoin as a multi-year savings tool. This is best visualized by the famous "HODL Waves" chart, which looks at the entire bitcoin supply over time and uses colors to indicate the distribution of balances held for various lengths of time. Hotter color bands show the percentage of the supply that was moved recently, in the prior days, weeks, or months. Cooler colors show the percentage of the supply that has been sitting dormant for years.
HODL Waves
The supply, banded by how long it's been sitting still.
While the chart demonstrates a pattern of "waves" coinciding with the price of bitcoin rising and falling, holding bitcoin for the long term is clearly a growing trend. The short-term fluctuations in bitcoin's price are likely explained by the volume of bitcoin held for shorter durations, while the overall growth of bitcoin's value across time appears to be the result of an increasing demand to use it as savings over multi-year durations.
As this trend continues, the supply of actively circulating bitcoin is becoming more constrained. With growing demand from newcomers and a shrinking available supply, bitcoin tends to get more expensive over time. Those interested in acquiring bitcoin may find it easier to do so now than in the future.